Blog
Key Event Engagement Metrics to Measure Networking ROI and Sponsor Value
.png&w=64&q=75)
.png&w=1600&q=75)
For many event organisers, reporting still begins with the most visible numbers: registrations, attendance, app downloads, session scans, and survey scores. These metrics matter, but they are only the starting point. They tell you whether people showed up, but they do not always tell you whether people participated meaningfully, made relevant connections, created sponsor value, or saw enough value to return.
Imagine a 700-person association conference closing with strong attendance, a busy expo floor, and positive survey scores. Two days later, the sponsor lead is asking which meetings actually happened, the programme manager wants to know which sessions created follow-up interest, and the CEO wants proof the event created value beyond turnout.
That is when attendance is no longer enough.
The real question is not only whether the event ran smoothly. It is whether the event created measurable participation, useful connections, sponsor value, and momentum after the day itself.
That is where stronger event engagement metrics matter. Modern event analytics platforms and event platform reporting should help organisers see more than surface-level activity. They should help teams understand what the event actually created beyond logistics, attendance, and general feedback.
Why Basic Event Reporting Is No Longer Enough
Traditional event reporting tends to focus on operational success. It tells you whether registrations were healthy, attendance hit target, the programme ran on time, sessions were scanned, the event platform was accessed, and post-event feedback looked positive.
Those numbers are useful, but they are incomplete. If your event promise includes networking, community, sponsor engagement, stakeholder value, or long-term attendee relationships, then your reporting needs to measure those outcomes more directly.
Attendance tells you who turned up. Participation shows who got involved. Connection shows whether people met others who mattered to them. Post-event momentum shows whether the experience continued after the room cleared.
That difference matters because events are increasingly judged on more than delivery. Leadership and commercial stakeholders want clearer evidence that the event created value, not just proof that the logistics worked.
This is part of a broader measurement gap for modern event teams. For a deeper look at why attendance alone does not prove value, read Why Event Attendance Data Is Not Enough to Measure Event Success.
A stronger reporting model should help organisers answer practical questions. Did attendees connect with the right people? Which formats created the strongest participation? Where did sponsor value come from? Which event experiences led to follow-up activity? Did first-time attendees take another step?
These are the questions that move event reporting from activity tracking to value measurement.
Why Event Teams Need More Than Logistics Reporting
Most event tools are good at showing what happened operationally. They can help teams see what was scheduled, who registered, who checked in, which sessions were accessed, whether the app or platform was opened, and which emails were clicked.
That information matters, but it does not always answer the deeper value questions organisers now need to answer. Who discovered relevant people? Which formats led to useful conversations? Did sponsors engage with the right attendees? Did speaker content create discussion after the session? Did the event create momentum beyond the day itself?
This is the reporting gap many organisers are trying to close. The issue is not usually that teams have no data. It is that the data they have is often weighted towards logistics, not participation, connection, and stakeholder value.
Better event analytics platforms should help close that gap by making the right signals easier to see, understand, and act on. For a related buying lens, see How to Choose Event Analytics Platforms for Measuring Engagement and Connections.
A Simple Framework for Event Engagement Metrics
A useful event reporting framework can be built around four layers: attendance, engagement, connection, and outcomes.
Attendance metrics show who registered, who attended, and where turnout was strong or weak. Engagement metrics show how actively attendees interacted with sessions, content, people, sponsors, and the overall event experience.
Connection metrics show whether attendees found relevant people, joined useful conversations, and created relationship value. Outcome metrics show what happened afterwards, including follow-up activity, sponsor value, repeat participation, and ongoing community momentum.
This framework helps event teams avoid treating all activity as equal. A click, a scan, a conversation, and a follow-up meeting are not the same type of value. Good event engagement metrics help organisers understand the difference.
1. Registration-to-Attendance Conversion
Registration-to-attendance conversion is one of the most important baseline metrics because it shows how effectively your event turns initial interest into actual attendance.
What to track
- total registrations
- confirmed attendees
- attendance rate
- no-show rate
- attendance by ticket type, audience segment, or registration source
Why it matters
A large registration number can create false confidence if a significant portion of people never attend. Strong conversion suggests genuine demand and clear intent, while weak conversion may point to friction, poor timing, unclear value, weak reminders, or over-reliance on top-of-funnel promotion.
What this helps prove
This metric helps organisers forecast more accurately, reduce budget waste, and understand which audiences are most likely to show up. It also gives leadership a more realistic view of event demand. Registrations show interest; attendance shows commitment.
2. Session Participation
Not every attendee engages equally once they arrive. Some attend multiple sessions, ask questions, join discussions, and stay involved throughout the day. Others attend one session and disengage.
Session participation helps organisers understand which parts of the programme created attention and relevance.
What to track
- percentage of attendees joining at least one session
- average number of sessions attended per person
- attendance by session, topic, track, or speaker
- drop-off between agenda blocks
- dwell time in sessions
- participation in Q&A, polls, or discussion prompts
Why it matters
This metric helps organisers understand whether the programme matched attendee interests. It can also reveal which formats sustained attention and which moments created drop-off.
For example, a session with moderate attendance but high Q&A activity may be more valuable than a packed session where attendees disengaged quickly.
What this helps prove
Session participation helps justify speaker investment, improve future agenda planning, and identify which topics created meaningful interest. It also helps organisers design future events around what attendees actually engaged with, not just what looked strong on the agenda.
3. Active Platform Usage
A download or login does not prove meaningful event engagement. Many event teams overestimate platform success by focusing on access instead of active use.
The better question is:
Did the platform help attendees participate, connect, and find value?
What to track
- activation rate
- daily active users
- repeat usage across event days
- average time spent in the platform
- saved sessions or bookmarked content
- messages, connection requests, or profile views
- use of networking, sponsor, or discussion features
Why it matters
A platform may look adopted on paper but still fail to support the attendee experience if people only open it once. Active usage gives a clearer view of whether the event technology helped people navigate the event, discover relevant opportunities, or take action.
What this helps prove
This helps event teams understand whether their platform supported participation or simply acted as a digital agenda. It also helps teams improve onboarding, simplify the experience, and invest in the parts of the platform that attendees actually use.
4. Discovery Readiness
Networking works better when attendees can understand who else is there and why they may be relevant. If profiles are incomplete, participant lists are hard to search, or attendee interests are invisible, connection becomes more random.
Discovery readiness measures whether attendees had enough information to find relevant people, topics, and opportunities before they needed to make decisions in the room.
What to track
- profile completion rate
- percentage of attendees with interests, tags, goals, or searchable details
- networking visibility opt-in rate
- number of attendees browsing profiles or participant lists
- topic or interest selections before the event
- saved people, sessions, sponsors, or discussion areas
Why it matters
Many attendees want to connect but do not always know where to start. Discovery readiness reduces social friction by making relevance easier to see.
This is especially important for first-time attendees, quieter participants, sponsor-backed events, association conferences, and community-led gatherings where connection is a major part of the event promise. For more on this problem, read Why Attendees Leave Events Without Making the Right Connections.
What this helps prove
This metric helps organisers understand whether attendees were set up to make useful connections. It also supports better segmentation, follow-up, and personalisation after the event. The more clearly attendees can see who and what is relevant, the less networking depends on luck.
5. Connections Made
Connections made per attendee is one of the clearest event networking ROI metrics. It shows whether attendees are actually forming connections rather than simply moving through the programme.
What to track
- connection requests sent
- accepted connections
- introductions made
- meetings booked
- average connections per attendee
- percentage of attendees making at least one connection
- connections by attendee type, role, topic, or segment
Why it matters
If networking is part of the event value proposition, then connection activity should be measured directly. Otherwise, organisers are left relying on assumptions.
A room may feel busy, but that does not prove attendees met the right people.
What this helps prove
This metric gives organisers a more credible view of networking performance. It can also help compare different event formats, improve future networking design, and support stronger event marketing.
Instead of saying the event was a good networking opportunity, organisers can show whether connections actually happened.
6. Connection Quality
Connection volume is useful, but it is not enough. Five relevant introductions can be more valuable than twenty low-value interactions, so connection quality helps organisers understand whether networking was useful, not just active.
What to track
- attendee feedback on whether they met someone relevant
- perceived quality of introductions or matches
- follow-up intent after conversations
- meeting satisfaction scores
- sponsor or exhibitor feedback on lead relevance
- qualitative comments about networking value
Why it matters
This is where event networking analytics become more strategic. The aim is not only to count activity. The aim is to understand whether the event helped people meet others who mattered to their goals, challenges, interests, or role.
A high number of interactions with low relevance may indicate noise. A smaller number of high-quality conversations may indicate stronger event value.
What this helps prove
Connection quality helps organisers improve networking design, support sponsor renewal conversations, and understand whether attendees saw real value from the experience. It also helps distinguish between surface-level activity and meaningful engagement.
7. Networking Format Performance
Different networking formats create different outcomes. A drinks reception, hosted roundtable, app-based matching experience, community discussion, speed networking session, and sponsor-led conversation will not perform in the same way.
Networking format performance helps organisers understand which formats created the strongest participation and value.
What to track
- participation rate by networking format
- opt-in rate for each activity
- completion rate for structured networking activities
- average time spent in each format
- attendee satisfaction by format
- connection quality by format
- follow-up activity linked to each format
Why it matters
Networking is often treated as a single category, but the format matters. Some formats are better for first-time attendees. Some work better for senior stakeholders. Some are more useful for sponsor conversations. Some create better peer discussion.
Without format-level reporting, organisers may keep repeating networking formats that feel familiar but do not create the strongest outcomes.
What this helps prove
This metric helps event teams invest in the networking moments that actually work. It also reduces wasted budget and makes future event design more intentional.
The goal is not more networking time. The goal is better connection design.
8. Sponsor Interaction and Value
Sponsors increasingly expect more than passive visibility. Logo placement, signage, and booth traffic still matter, but they do not always prove sponsor value. Sponsors want clearer evidence that the event helped them engage with the right audience in a meaningful way.
What to track
- sponsor profile views
- sponsor content interactions
- stand or booth visits
- meetings with sponsors
- lead captures
- opt-ins for sponsor follow-up
- attendee interest in sponsor-linked topics
- sponsor feedback on conversation quality
- post-event sponsor engagement
Why it matters
If sponsor reporting only shows impressions or exposure, ROI can feel vague. Stronger sponsor reporting connects sponsor presence to attendee relevance, interaction, and follow-up.
That helps shift the conversation from:
Were sponsors visible?
to:
Did sponsors have meaningful opportunities to engage?
What this helps prove
Sponsor interaction metrics help organisers demonstrate value, support renewal conversations, refine sponsorship packages, and improve future sponsor integration. They also help sponsors understand where their investment created useful engagement, not just brand presence.
9. Speaker and Content Follow-Through
Strong content should do more than fill a timetable. A keynote, panel, workshop, or fireside chat should create relevance, discussion, and post-event value.
Speaker and content follow-through metrics show whether content created momentum beyond the session itself.
What to track
- session attendance by speaker or topic
- questions submitted
- poll responses
- content downloads or saves
- post-session ratings
- discussion activity linked to session themes
- follow-up engagement with session materials
- registrations for related post-event activities
Why it matters
A session may be well attended but still have limited follow-through. Another session may create questions, conversations, content sharing, and ongoing discussion. That difference matters because attendance alone does not show which content actually created engagement.
What this helps prove
This helps organisers make better speaker, topic, and format decisions. It also increases the return on content investment by showing which ideas continued after the session ended. For speakers, it can provide a clearer view of how their contribution resonated with the audience.
10. Post-Event Momentum and Repeat Participation
Some of the strongest event ROI signals appear after the event. This is especially true for conferences, associations, sponsor-backed events, recurring event series, and community-led programmes.
Post-event momentum shows whether the event created enough value for people to take another step.
What to track
post-event email engagement by segment
registrations for related activities
meeting bookings after the event
sponsor follow-up opt-ins
content re-engagement
return participation intent
first-time attendee to second-action conversion
returning attendee rate
repeat participation across multiple events
movement from attendee to contributor, speaker, sponsor, volunteer, or community participant
Why it matters
An event can generate a spike in attention and still fail to create lasting value. Post-event momentum helps organisers understand whether people continued engaging after the event window closed.
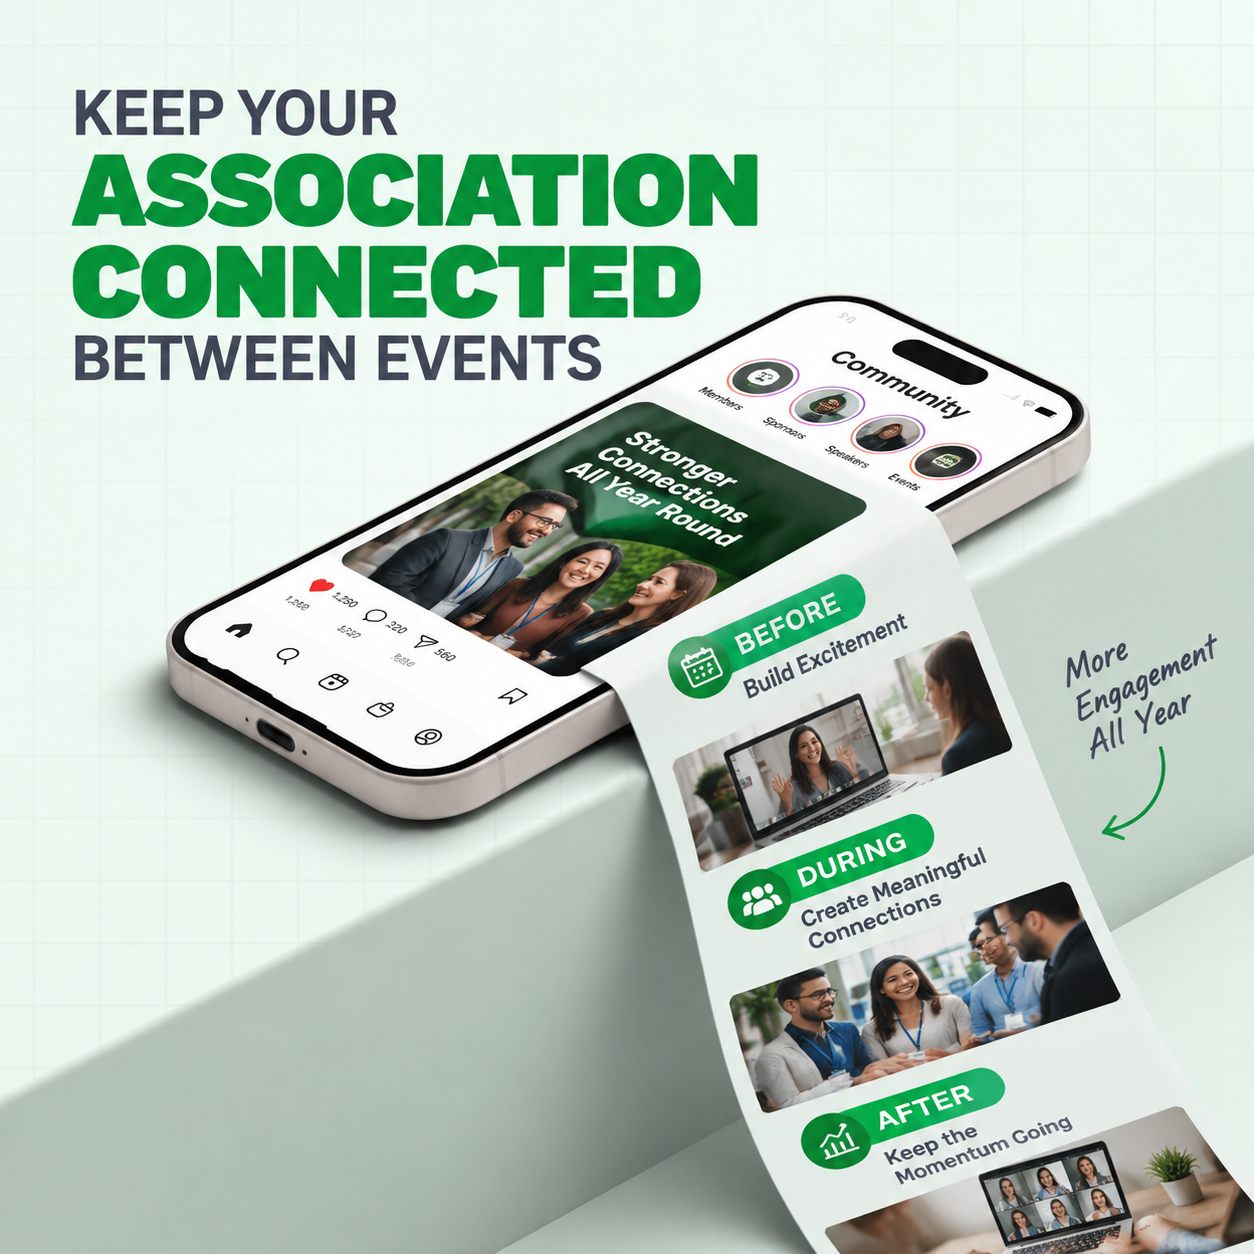
This is where the before, during, and after event journey becomes important. The event should not be judged only by what happened on the day. It should also be judged by what the day made possible afterwards.
For associations looking beyond a single major event, this connects closely with Member Engagement Ideas Between Annual Events.
What this helps prove
This metric helps organisers measure the longer tail of event value. It supports better nurture, stronger community planning, clearer sponsor reporting, and more confident investment in future events.
It also helps show whether an event is becoming part of a broader ecosystem, rather than a one-off gathering.
What Good Event Platform Reporting Should Show
Good event platform reporting should not simply give organisers more numbers. It should make the right signals easier to understand.
That means reporting should show:
- Trends, not just totals: whether participation, connection, and follow-up are improving over time
- Segments, not just averages: how different attendee groups, ticket types, chapters, roles, or sponsor audiences behaved
- Before, during, and after activity: whether engagement started before the event and continued afterwards
- Quality, not just quantity: whether conversations, introductions, and sponsor interactions were useful
- Stakeholder-specific views: what organisers, sponsors, speakers, leadership, and community teams each need to understand
- Operational effort: whether the platform reduced admin or created more manual work for the team
This is where event analytics platforms become more useful. Not when they track everything, but when they help organisers see what mattered, who it mattered to, and what should happen next.
What Organisers Should Capture
A practical event engagement reporting model should show what happened, how it happened, and who it matters to.
| What to capture | How to capture it | Who it helps |
|---|---|---|
| Attendance commitment | Registration-to-attendance conversion, no-show rate, attendance by segment | Event teams forecast demand and reduce wasted budget |
| Session participation | Session attendance, dwell time, questions, poll responses, topic interest | Programme teams identify which content and formats created engagement |
| Active event platform use | Logins, repeat usage, saved sessions, messages, profile views, feature activity | Organisers understand whether technology supported participation |
| Discovery readiness | Profile completion, interest tags, networking opt-ins, attendee browsing behaviour | Attendees find relevant people and organisers improve matching or follow-up |
| Connections made | Connection requests, accepted connections, meetings booked, introductions made | Event teams measure whether networking actually happened |
| Connection quality | Attendee feedback, follow-up intent, meeting relevance, sponsor lead quality | Leaders and sponsors understand whether interactions were useful |
| Sponsor engagement | Sponsor profile views, meetings, opt-ins, booth visits, content interactions | Commercial teams demonstrate sponsor value beyond visibility |
| Content follow-through | Downloads, saves, session-linked discussions, post-event resource engagement | Speakers and organisers see whether ideas continued after the session |
| Post-event momentum | Follow-up activity, second actions, repeat participation, community engagement | Leadership sees whether the event created value after the day itself |
| Organiser efficiency | Reporting turnaround time, manual exports, setup time, support requests | Event teams understand whether systems reduced or increased admin burden |
This table helps event organisers move from general reporting to practical visibility. The aim is not to track every possible interaction. The aim is to understand whether the event created participation, connection, and outcomes that matter.
How to Turn Metrics Into Better Event Decisions
Collecting event engagement metrics is only useful if the signals lead to better decisions. The strongest reporting does not just show what happened. It helps teams decide what to improve, where to invest, and what follow-up should happen next.
| Metric group | Where the signal is usually captured | Who should see it | What decision it helps |
|---|---|---|---|
| Registration and attendance | Registration platform, check-in data, CRM, ticketing reports | Event, marketing, and leadership teams | Improve targeting, reminders, forecasting, and resource planning |
| Session participation | Session scans, agenda saves, Q&A, polls, content downloads | Programme and content leads | Refine agenda flow, speaker selection, topic mix, and session formats |
| Platform usage | Event platform activity, saved sessions, profile views, message activity | Event operations and technology owners | Decide whether the platform supported participation or created friction |
| Discovery readiness | Profile completion, interests, tags, networking opt-ins, attendee browsing | Event and community teams | Improve attendee onboarding, discovery prompts, and networking preparation |
| Connections and introductions | Messaging, meeting bookings, host notes, QR interactions, post-event surveys | Event, community, and sponsorship teams | Improve networking design, hosted introductions, and sponsor matching |
| Connection quality | Attendee feedback, sponsor notes, follow-up intent, meeting relevance | Leadership, community, and commercial teams | Separate useful engagement from noisy activity and improve future formats |
| Sponsor value | Sponsor profile views, meetings, opt-ins, content engagement, lead quality | Sponsorship and commercial leads | Strengthen renewal conversations, package design, and sponsor follow-up |
| Post-event momentum | Email engagement, follow-up registrations, community activity, second actions | Community, membership, and event teams | Identify who should receive next-step invitations, introductions, or nurture |
| Organiser efficiency | Setup time, reporting turnaround, manual exports, support requests | Event operations and leadership | Assess whether systems are reducing admin or adding another reporting layer |
This is where reporting becomes practical. If registration-to-attendance conversion is weak, the team can review reminders, positioning, and audience source quality. If connections made are low, the issue may be discovery, facilitation, or networking format design. If sponsor interaction is high but follow-up is low, the event may need clearer sponsor calls to action and post-event pathways.
The goal is not to create a larger reporting pack. The goal is to turn fragmented event activity into usable community knowledge: what happened, who engaged, where value was created, and what should happen next.
What Good Event Reporting Should Help You Prove
The best event reporting does not simply produce more numbers. It helps organisers prove three things clearly.
1. The Event Created Participation
This means attendees did more than arrive. They joined sessions, asked questions, responded to prompts, explored relevant topics, contributed to discussions, or took part in the experience in visible ways.
2. The Event Created Connection
This means the event created clearer pathways to useful interaction. The focus is not only how many conversations happened. It is whether those conversations were relevant and valuable.
3. The Event Created Outcomes
This means the event led to something beyond the day itself. That might include follow-up meetings, return participation, sponsor renewal confidence, content engagement, community activity, volunteer interest, or stronger attendee intent to come back.
If your current reporting cannot show those things, the issue may not be lack of data. It may be that the wrong metrics are being prioritised.
Final Thought
The most useful event engagement metrics do not just confirm that people showed up. They help event teams understand whether people participated, connected, and saw enough value to take another step.
That is the real shift in measuring networking ROI and sponsor value: from counting activity to measuring value.
For event organisers and conference teams, this creates better insight into event design, attendee experience, sponsor conversations, speaker and content impact, post-event momentum, platform investment, stakeholder reporting, and future planning.
The right event platform reporting framework helps teams stop asking only how busy the event was. It helps them ask how valuable it really was.
Because a successful event is not only one that runs smoothly. It is one where people participate, connect, and carry value forward after the event ends.
Looking for Clearer Event Engagement and Networking ROI?
SixSides helps event organisers create stronger participation, clearer connection pathways, and more measurable stakeholder value before, during, and after the event.
For teams trying to understand what their events actually create beyond attendance, SixSides provides a practical way to support connection, participation, sponsor value, and post-event momentum without adding more manual reporting work.
Use the Book a demo option on this page to see how this could work in practice.
Give your event a community that lasts
A branded app where members show up before day one and stay long after the close. We'll walk you through it.

.png&w=800&q=75)